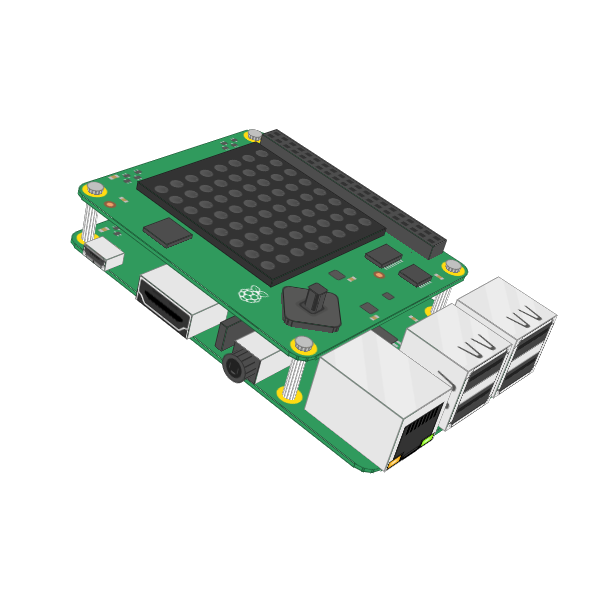
IoT Sensor Data
This section displays the SenseHAT image (scaled to 33% smaller), six sensor readings, and a 30-second rolling chart (with the right edge representing the current time and the left edge representing 30 seconds earlier). Note that the data is currently generated by a backend component (i.e., it is dummy data). This component can be adjusted to receive data from an actual device, such as a Raspberry Pi.
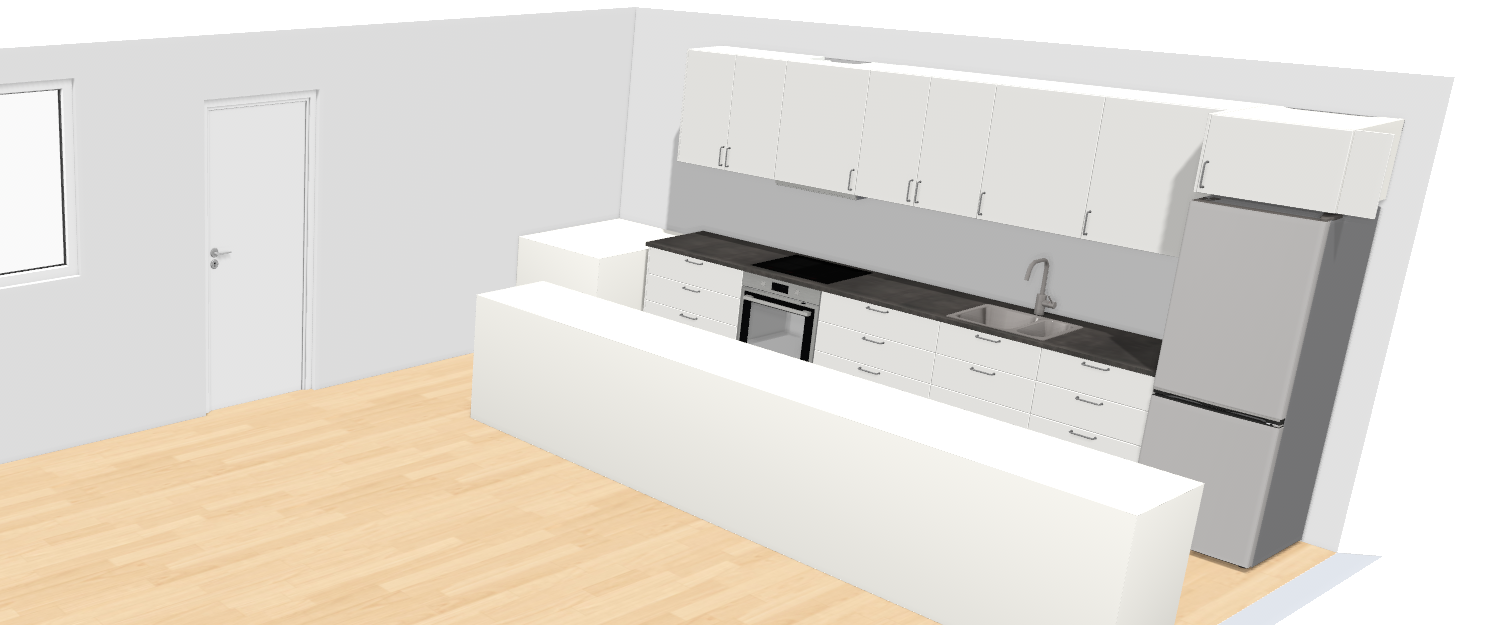
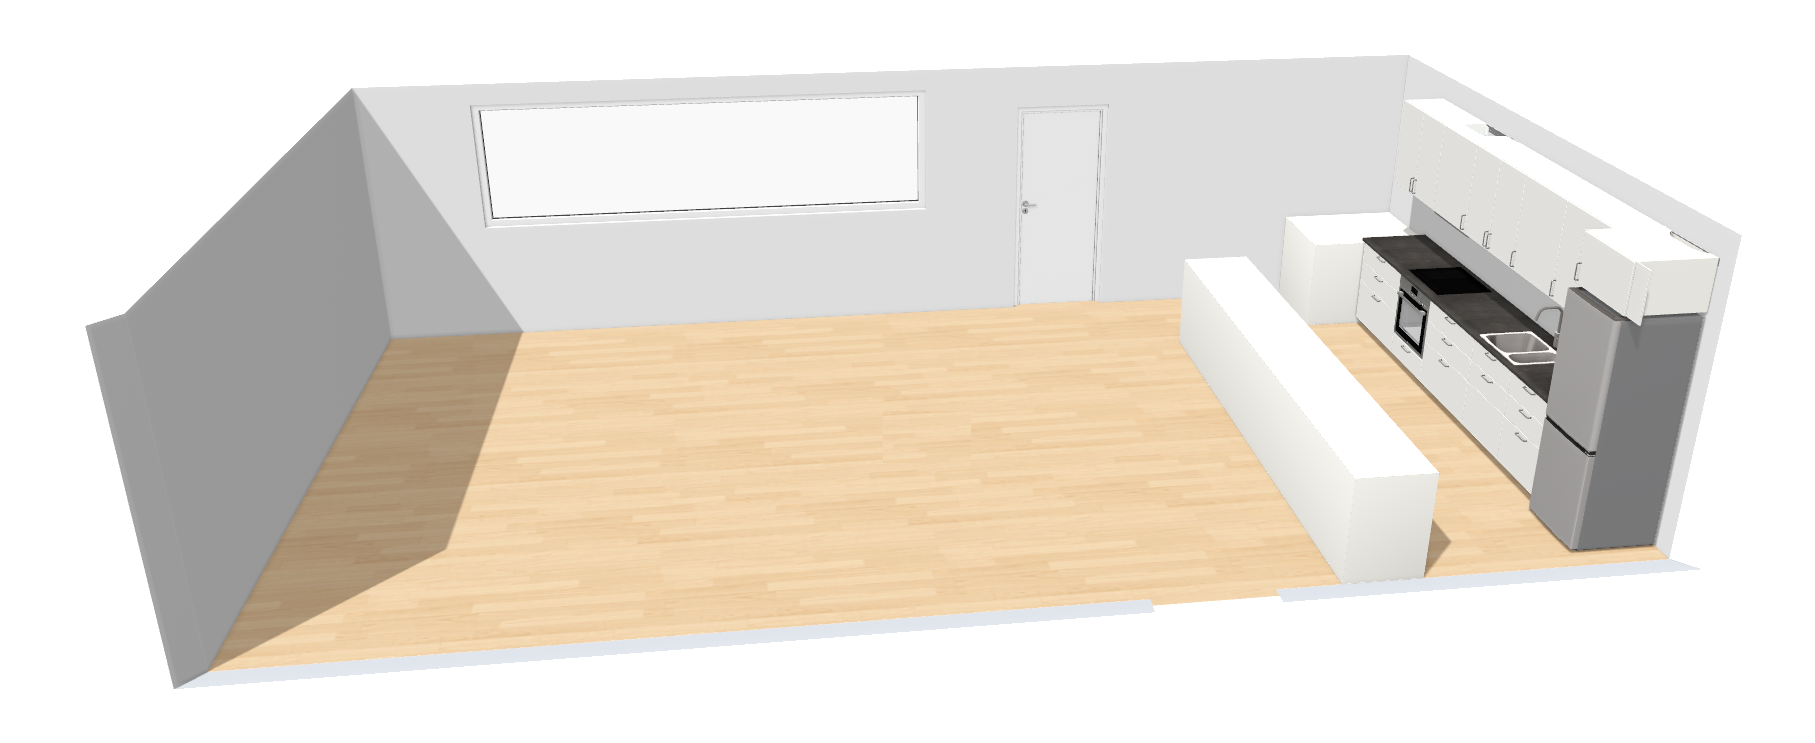
Digital Twin Kitchen View (Main)
Below is a pie chart showing the population of the kitchen, detected through a Raspberry Pi's webcam and backend services for object recognition. Note that the data is currently generated by the backend component (i.e., it is dummy data). This component can be adjusted to receive input from an actual device, such as a Raspberry Pi. It would use image recognition to detect the number of people in the room and update the data accordingly.
Digital Twin Kitchen View (Utilities)
Below are pie charts displaying the number of coffee servings in the coffee machine, clean cups available, and coffee beans stored for brewing the next batch of coffee. These numbers are currently generated by the backend component and are static. In a real-world use case, the values could either be estimated automatically based on the number of people detected in the kitchen (using assumptions), or updated manually by letting users tap a button on the Raspberry Pi's touch display for each cup of coffee they take.